
Forecasting Severe Storms - A Practical Look Lets look at a typical situation and see how we can apply this. I dug up some forecast charts that I saved from the December 4, 2002 Brisbane supercell. Lets have a look at the charts and see what we can apply... This day was actually my last chase day on my annual chase holiday "Thunder Downunder 2002." It ended up being one of the best chases of the year! James (my chase partner) and I were up early but were quite tired from the night before, we had travelled 1100km the day before and didn't get to sleep until well after midnight. We decided to get some McDonalds for breakfast, then sat down to have a look at the situation. I'm doing this in order of how I remember going through this. Because I was on a laptop connection using my mobile - everything was slow! Furthermore, we had to get ready early as we did a tyre the day before and had to try and find a new one and didn't want to start out too late! So we had to look at everything quickly, so I decided to load everything up at once. The first thing that loaded for us was the forecast: SOUTHEAST
COAST CITIES PRECIS
A hot day was forecast! Taking the BoM's word for it, we were going to need a reasonable cap was in the back of my mind. The other thing that struck me was "NW winds gusty at times." Any situation with NW winds automatically grants a chance of becoming too dry. So the next thing I loaded up were some obs to get an idea on things:
Wow - what an impressive set of obs! DPs in the low 20s throughout, 28/22 at the airport at 7am!!! 29/21 at Amberley too! Mostly northerly winds, although it's a little drier on the Downs (Oakey and Toowoomba with DPs around 17-18). That's not too bad because they're both elevated (Oakey 500m, Toowoomba 650m) - you'll learn why that isn't a concern in the Skew-T section. What is a concern are those WNW winds at Toowoomba! Although Oakey is NNW which is OK. To get a better idea on things, (ie what the conditions were like further west), we loaded up the southern inland Queensland obs:
Alright, lets have a look at this. Dalby didn't fit on this (w of Oakey), but its 6am observation was 26/19. Inglewood 29/17, Goondiwindi (300km WSW of Brisbane), 27/20, Miles (350km WNW of Brisbane) 27/18. Looking good...Roma, 31/13 - aha! That's a bit low, although St George is 27/18 and is 200km S of Roma (this is where your geography comes in handy). Charleville is OK too, 32/15 - but you can see it's getting a bit dry out there, and the main SW boundary is back towards Cunnamulla (30/9 with SW'lies). Is it going to dry out? Just going by this, moisture doesn't look like it's going to be a problem! Lets get a second opinion though by loading a 1000mb shear chart. It'll also give us a good opportunity to check where the model thinks the trough will lie in the afternoon (don't get put off by its positioning, you might disagree and think it will lie somewhere else - go by your instinct).
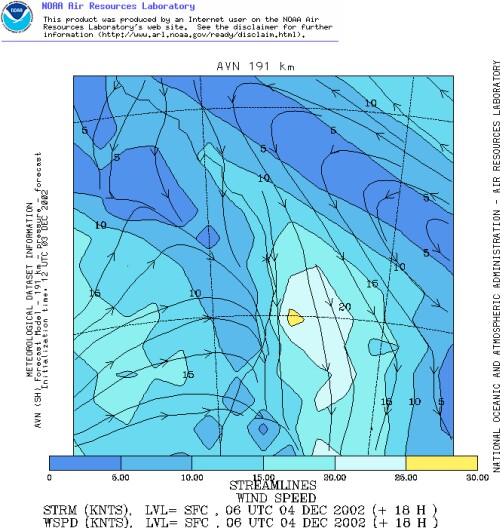
This shows a trough to our west which is good, sitting on the eastern side of the trough is the unstable area generally and is where the air is generally rising (air rises ahead of troughs). It shows those NW'ly winds too, but look where they're coming from - they're actually originating over the Coral! Certainly not going to dry out here I think! While we're looking at shear, lets look at the surface shear. 10-15 knots over SE QLD, getting up to 15-20 knots on the coast. Going back through our "magic numbers" this gives us moderate to strong inflow at the surface, off to a good start! Lets look at 850...
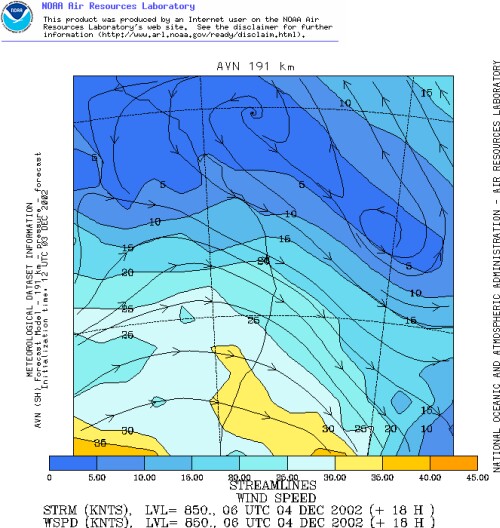
Ok, here we have NW winds at around 20 knots at the 850mb level...remember that direction, we're going to need it to work out which way storms are going to move! Referring to our magic numbers we see that 20 knots sits in the "good" category for 850mb.
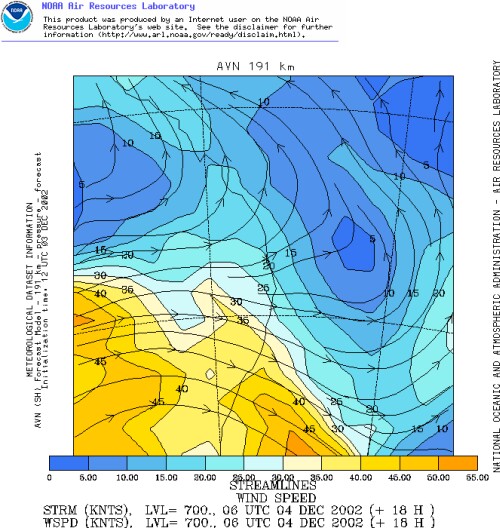
Here's our 700mb chart, those winds have swung towards the west. This was interesting in both ways, it added directional shear too! (You guessed it...explained in the Skew-T section). The wind speed is 20-25 knots (oh, the little asterix is Brisbane in case you were wondering...to the SW the latitude/longitude intersection is 30S, 150E). Once again, referring to our magic numbers this sits in the "good category" - doing well so far!
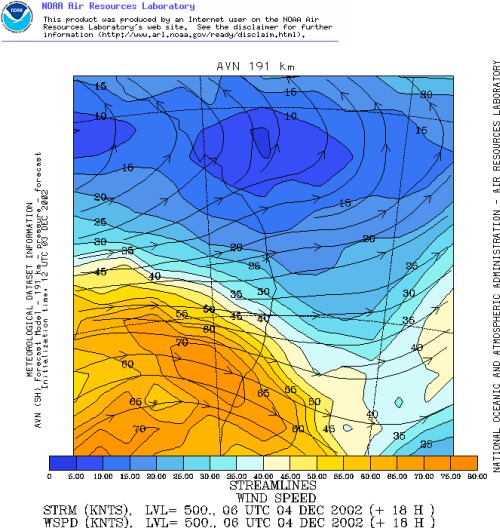
Here's the 500mb winds, from the WSW now and again at around 20-30 knots. However if we check our magic numbers table, it only sits as "adequete." Remember, these are not concrete numbers and are relative to what the other shear is. Sure the 500mb winds aren't ideal, but hey - the 850 and 700mb winds aren't bad, and the 1000mb winds are quite strong for our area. Lets check the 300mb level before we start panicking...
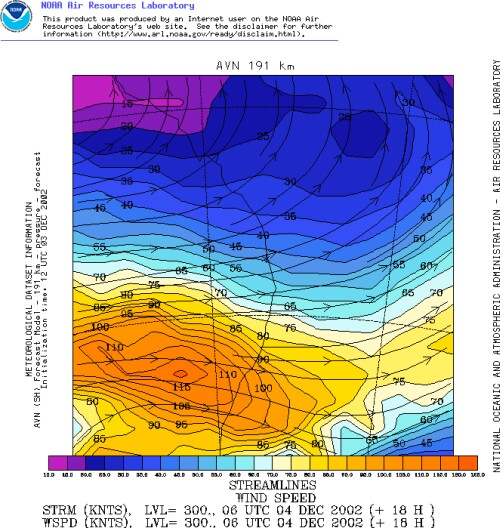
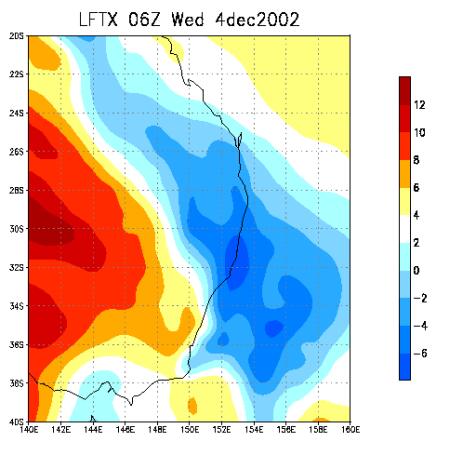
The 300mb chart shows 50-60 knot winds from the WSW through SE QLD, which once again sits in our "good category." So as a quick summary, the shear - it's not fantastic, but it's pretty reasonable and I'd be relatively happy with this for severe storms providing there was some decent instability. Oops, no point in having shear if there's no instability! Lets check it, we're low on time so we'll just check the LIs...
Alright! Some nice instability poking into SE QLD there, -4 to -6 LIs is certainly nothing to be sneezed at. Ok...before we continue, have a look at what I've presented. I've concentrated on describing the setup in SE QLD, but look at the instability and the shear. The instability and shear actually gets stronger further south!!! Well, there is one thing I didn't show in order. One of the first things I load up automatically is the satellite image! Lets have a look at it...
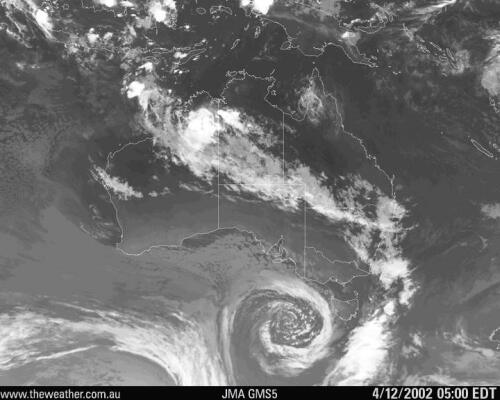
This is the 5am EDT (4am EST) satellite image. From Stanthorpe the cloud was just clearing off, but have a look at the line of cloud off to the west. There's more cloud lining up for NE NSW than SE QLD, so that in itself is a deterrent. Have a look at the LIs and then have a look at the 1000mb winds too. The instability is right on the coast, but tends more inland further north. The trough is very close to the coast in NE NSW, perhaps too close. No point in having storms develop 20km inland from the coast and then having them move out to sea! It's nice to have storms develop at least a little inland so you can chase them to the coast. Speaking of which, which way are storms going to move? I generally try and "average" out the wind speeds and directions in my head. We have 20 knot NW'ly @ 850mb, 20-25 knot W'ly @ 700mb and 20-30 knot WSW @ 500mb. Averaging these out gives a generally easterly flow, but I'm about to throw a spanner into the works... Storms tend to move to the left of the steering flow (ie equatorward), this is to do with the positioning of the updrafts, they like to feed on the warm northerly winds, so the updrafts are often orientated so that they are more favoured on the northern (equatorward) edge. They will move even more left if the winds are weaker, but not so much if the winds are stronger. And stronger thunderstorms tend to move even further left of the mean steering flow. It's not unusual to see larger storms move to the left of other storm movement either, for instance weaker storms might be moving ENE, but stronger storms NE, or sometimes even NNE and even N! Anyway, back to December 4! We've established that while in theory our instability and shear is better south, it may not actually be the best area due to other factors. Lets look at one other thing - the cap, and we can use 850mb temperatures to help...
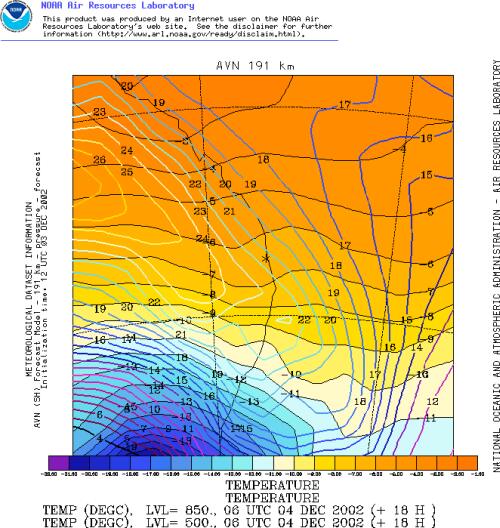
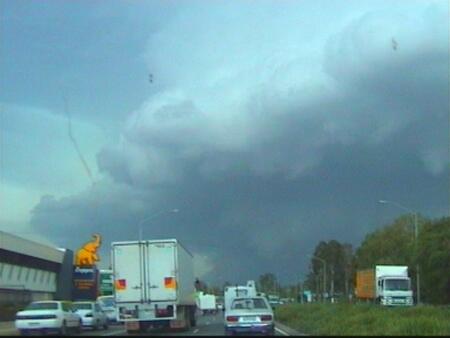
I often like to overlay the 850mb and 500mb temperatures, lets ignore the 500mb temps for the moment (although they're kinda warm...-6 to -7C @ 500mb, but it's quite moist and very hot so that's bringing the instability!) But check out those 850 temps, yeouch!!! 21 to 22 over SE QLD, solid 22 over NE NSW, and 23-24 further west. Given that NE NSW has to contend with some cloud (even if it's just for the first few hours in the morning), when you've got those types of 850mb temperatures you need all the heat you can get! Even at 21-22C I was concerned the cap was going to be too strong, the only thing we could try and bank on was it was going to get hot. Hot was a bit of an understatement...James and I were sitting at Warrill View when it was 42/18!!! Anyway, to cut a long story short, if you want to see what happened - check out the December 4 supercell chase report! The result was one very nice supercell through south Brisbane, it interacted with the seabreeze front. A squall line developed behind it and gave some severe winds to the Downs, but nothing in SE QLD. The squall line developed on the main trough and moved over.
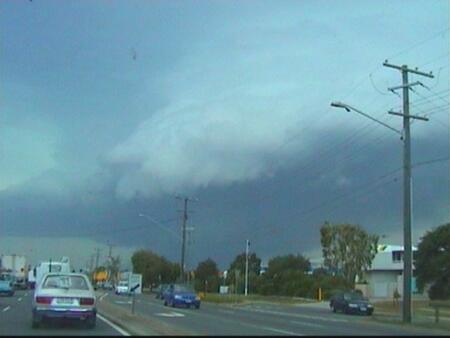
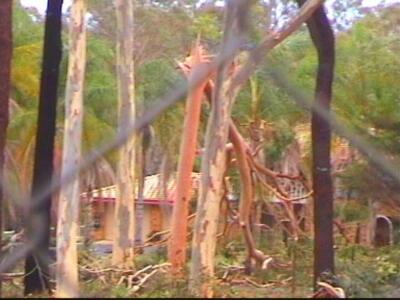
And the aftermath...
Click here for radar, storms actually developed early in the afternoon due to the extreme heat. Notice the rapidly development south of Amberley? That's the start of our supercell (not very long lived), but a great storm nonetheless! Also notice how it moves towards the NE, while everything else is generally moving E or ENE? Pretty much the smaller storms and showers are going with the mean steering flow, but since this storm is stronger it's going to the left of the steering flow! Well, that concludes the first part of this guide. The second part is a little more involved and follows from this. I'd recommend you take some time to digest this first before moving onto the section part, otherwise it might be a bit difficult to remember it all! |