HomeAustralian Severe Weather AssociationStormchasing ReportsPhoto GalleriesStorm InformationLinksAssorted Items

Interpreting Skew-Ts (Part Three)

Understanding Skew-Ts and some of the information previously presented now allows us to learn a few more things.  Have you ever noticed that storms have a tendancy to favour the ranges?  Why is this?  Most people think that this is due to the extra convergence (ie, additional lift as wind climbs the ranges), this is somewhat true, it does help break the cap and initiate convection.  But what about those really marginal days when there's barely enough energy for storms to develop - the ranges still fire, but storms then weaken or sometimes die as they come off the ranges.  Why is this?

This brings about the concept of elevated heating and another concept I (somewhat colloquially call) pressure heating.  Don't ask me how I derived the second one!  But essentially, it is this:

- Elevated heating results in an effective higher temperature and dewpoint (therefore increasing instability).
- Pressure heating results in an effective higher temperature and dewpoint (therefore increasing instability).

Make sense?  Probably not...so lets get some examples on the way!


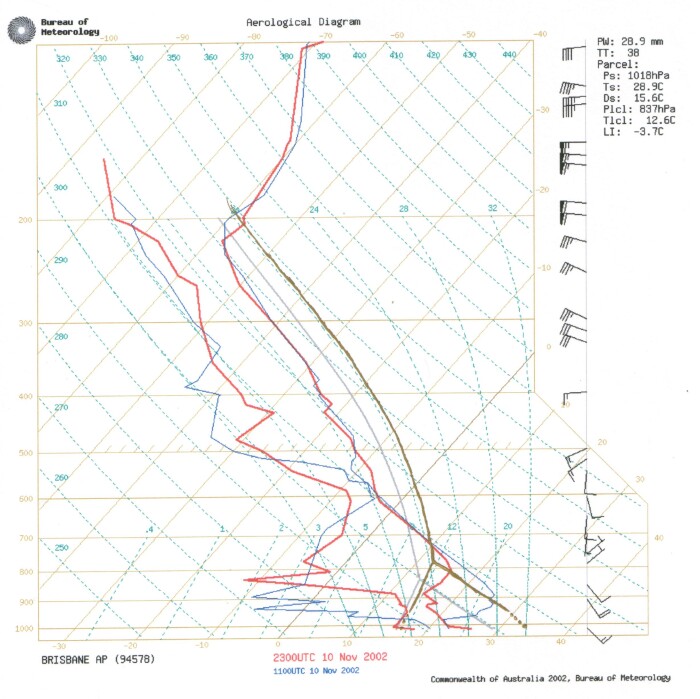
Here we have a sounding on the morning of November 11.  There is a fair bit of instability if it reaches close to 30 degrees with a DP of around 16C.  (Notice that in this example that a DP drier than the surface was chosen?  I'll explain why that's the case soon - but it's to do with averaging the low level moisture).  The problem is that there is a massive cap!  Unfortunately on this day, while it actually got into the low 30s on some of the plains of the SE Coast region, nothing happened.  In fact, one storm that did move into the region died as it came off the ranges.  If you're not familiar with the topography of SE QLD (where I live), then here's a quick run down.  SE QLD is surrounded by ranges to the south and to the west.  Ranges to the south are along the border of NSW and QLD and get up to 1300m.  Ranges to the SW get up to 1200m and to the west they get up to 800m.  To the west is what is referred to as the "Darling Downs" - a large farming region that goes several hundred kilometres inland.  The Downs is one of my favourite playgrounds - not just because it's flat and few trees either!  But because it's elevated, in fact most of the Downs is around 500m high!

So what's so important about height?  Well - what happens as you ascend?  The pressure drops!  In the bottom 1-2km, the pressure drops at approximately 1hPa every 10m.  So say the pressure is 1000hPa at the surface, if you ascend 100m then the pressure is now 990hPa.  If you ascend 500m the pressure is 950hPa and if you ascend 1000m the pressure is 900hPa.  Remember how we used Normand's Theorem to plot our Skew-T, and we started at the surface?  Normally the surface is taken to be around 1000hPa, but what if it were say 950hPa?  We would then have to plot our temperature and dewpoint commencing from the 950hPa level!  Normally as you ascend, the temperature and dewpoint decrease (in fact, this should be at around 1C/100m), but that isn't actually the case over land!  For instance, at an elevation of 600m, about 20km south of Toowoomba on November 11, I measured a temperature of 29 degrees.  The sea level pressure at the time was around 1010hPa, which meant the actual pressure I was experiencing was around 950hPa.  The dewpoint was hovering around 15-16C.  Essentially, at 600m it was the same temperature and dewpoint as plotted at 0m (sea level) on the above Skew-T.  So we're going to get a good idea on how increasing the altitude can really help increase the instability!

Here we are with our new plot, plotted at 600m (or in this case 950hPa), look how much more instability we have!  Just going by LIs along we've gone from -4 to -7!  That cap has weakened a lot too, much more breakable then before.  I've also drawn (well attempted, it didn't work too well) to draw in some dashed lines from 950hPa to 1010hPa to illustrate the equivalent surface potential.  Had I had a steady hand, you would see that the surface potential of 29C at 600m is around 35C!  (ie 1C per 100m), and the DP ended up being around 17C from 15C.  So you can clearly see here how elevated heating increases the instability and can also help to break the caps.  This is a major thing to realise if you're chasing say on the Tablelands (large areas over 1000m) or the slopes and plains that lie to the west of these areas.  So what happened on this day?  A storm I chased gave cricket ball hail and severe winds that destroyed several sheds and barns.  I missed the hail (fortunately!)  There were some even stronger storms in the northern Downs but few people live there.  Check the chase report anyway if you're interested!

This also brings about "pressure heating."  Think about it if the pressure is 1000hPa vs 1020hPa.  For every 10hPa higher that the pressure is over your area, then that's the equivalent of 1C cooler when you look at it in terms of instability potential.  This is another reason why lower pressure is good - winter storms can struggle because the pressure can be in excess of 1020hPa - that means that it is effectively 2C cooler at the surface already then the same situation in summer at 1000hPa (even ignoring the summer/winter temperature differences).  So areas of low pressure also help increase the instability - while areas of high pressure decrease it.  Not to mention the fact the areas of low pressure often have already rising air and areas of high pressure have sinking air which surpresses updrafts.

I mentioned that the BoM often takes an average of the surface moisture - in fact, a lot of sites that plot soundings do this.  There is a good reason for this, it's to do with mixing during the day.  Lets think about our convective process.  The initial convective process occurs in rolls, in lower 1-2km of the atmosphere you tend to have air rise from heating, and then cooler air around it sinks.  This cooler air is then heated in the lower atmosphere by the sun and the ground.  Already we can see two things here!  Our convective "roll" will not go past the initial cap, so if the cap is say at around 2km, then our convective roll won't go past 2km and then all our heat energy is "trapped" underneath the cap.  If there is a weaker cap, then a lot of our heat energy can escape into the upper atmosphere as convective clouds - not what we want if we want stronger thunderstorms.

The other thing we can see is, if the surrounding air in the lower atmosphere is dry - what is going to happen when it mixes in the surrounding air?  For instance, lets say there is a DP of 20C at the surface - lovely and moist!  But 500m up the DP is only 10C, then that dry air will eventually mix down towards the surface and give a combined DP much lower than 20C!  So our convective potential is subsequently diminished.  Lets look at some more examples.  Here is an example of what I call very shallow moisture:


Look at the surface - lovely DP of around 24C!  But then look up - look how much it dries out!  Lets assume that the inversion wasn't there, and we were able to allow a parcel of air to rise - what is going to happen when the surrounding air just above the surface begins to sink and mix in with the surface air?  It's going to dry out the surface very rapidly!  Hence why in this sounding you can see that the TAPP has been plotted at a much lower DP than the DP at the surface.  In fact, I would personally say the potential here would have a DP of around 10C - it's way too dry just above the surface.  It's important to know if the air is dry just above the surface, you want a nice deep surface moisture layer so the moisture doesn't "mix out" and ruin your storm potential!  And no there were no storms on this day!

On the other hand, lets look at a slightly moister situation at the surface:
 

Here's a sounding on the morning of the December 10, 2002 squall line through Brisbane.  Nice moisture again!  Dp at the surface of around 23C, but it drys out (just a little), but then the moisture remains relatively constant.  I often take an average of the lower 1km.  I want to see the lower 1km (eg below the 900mb level) to be nice and moist, ideally up to 750-800mb should be relatively moist too before beginning to rapidly dry out above 700mb (anything above around the 850mb level doesn't influence the surface directly).

I consider deep moisture critical to not only severe thunderstorms, but thunderstorms in general.  Shallow moisture depths can still produce thunderstorms, but only to an extent - this is something only your instinct and experience of the region can really decide, and even then it's very hard.  There are some situations that are more likely to "mix out" than others.  Situations to becareful of:

- When the low levels (925-850mb) turn back to the W (or even NW) very quickly and become strong.  This is fairly common in early spring, and if moisture is going to be a problem this will make it even worse!  (Ideally, winds should not go too much west of NW until 850 in general situations though, otherwise it will bring too much dry air into the low levels - always exceptions to the rule though).

- When there are hot, dry W'lies behind the pre-frontal trough it's generally not a good thing, as they have a tendancy to move through and dry out the low levels.

Lets look at an example of what I mean - the October 23, 2002 duststorm through Brisbane is a good (but extreme) example of this.  Here's the sounding on the morning:


Ok, here we have a sounding plotted with the day's expected maximum temperature and the current DP.  If it gets to 32C with an average DP of 15C, we're going to get -8 LIs!!!  That's pretty hefty - there's some beautiful cold air in the upper levels (you can see that the 400-600mb levels have cooled down a fair bit in the past 12 hours too).  The moisture depth is pretty good too - but it's already dried out compared to the sounding the previous night a fair bit, but if it were to stay around that then it'd be ok.  Will it stay?  Just looking at the sounding I'm getting nervous already - those winds are becoming W'ly very quickly, and they're strong.  30 knot NW'ly at 925mb and 40 knot NW at 850mb...hmmm...I guess it's *ok* (speed wise the shear is excellent!)  I guess it really depends of the origin of those NW'lies - that's the key.  Lets look...

Yikes!  Those NW'lies are originating from SW'lies over South Australia and NSW - not good!!!  No doubt there's going to be some dry air behind them...lets see if 925mb has anything better...

Hmm...nope!!!  Still originating from NSW and South Australia - but can you see the critical line?  There are two types of NW'lies here, some originate from north Queensland/tropics - others originate from NSW and South Australia.  This is a common situation - while NW'lies don't always equate to bad news, in this case they are - I nick name this the "critical line" - note though that where the critical line becomes diffuse is the danger point, because here there is an slow transition of moist, tropical NW'lies to dry NW'lies (pseudo-SW'lies).  Where as further north it becomes more defined it's less unlikely to dry out.  I find knowing where this is essential...I hate being in the diffuse area, I want it to be defined.  If you're in a difuse area you're in real strife and you're going to struggle.  Still, there were storms though on this day - very weak ones though and only within about 15km of the coast due to the dryness.  The line became more defined along the coast due to the seabreeze boundary.  Have a look at how defined it became right along the coast!

27/21 at the airport, but the city barely 10km away was 37/9!  Weak storms developed on the boundary, but with such dry air encroaching, there was no way storms could sustain themselves.  If you're interested, check out the chase report from the weak afternoon storms and the amazing duststorm that followed though!

Here's another example.  Here are some analysed surface streamlines from the morning of a supercell that moved through the border ranges area of SE QLD on December 22, 2001.

Here you can see there are NW winds over SE QLD - but look where they're originating from - originally over the Coral Sea!  As long as you're ahead of this point you're fine, but look in NE NSW where it's getting a bit diffuse and the transition is starting to get ill-defined to the other NW'lies originating from the SW - that's the danger point where it's likely to dry out.  The end result were some rather spectacular pyro-Cbs in NE NSW, but this was more due to the fires, had they not been there it perhaps would not have been as interesting.  Although later that evening a SE change pushed through and returned moisture for lightning!  The most severe storms on this day though appeared to be in SE QLD with tens of millions of dollars damage, especially to areas of the Gold Coast and the Border Ranges area from the afternoon supercell ahead of a squall line.

Skew-Ts certainly provide the edge over other methods such as LIs because you can modify them to suit your needs.  You can replot temperatures and dewpoints to get a better indication of the day's potential, and you can see caps and moisture trends much easier too!  I hope this Skew-T section has helped clear up how to read and interpret them and it helps you in your forecasting.  Until then, lets use our new knowledge of Skew-Ts to forecast a real day!