March 30, 2003 Case Study Ok, time for another practical example I think! But also a few new things that might come in handy. That is confirming the forecasts. What do I mean by that? Well - this is where a bit of experience and intuition can come in handy, but most of us can do this even on a basic level. For instance, lets look at the following forecast:
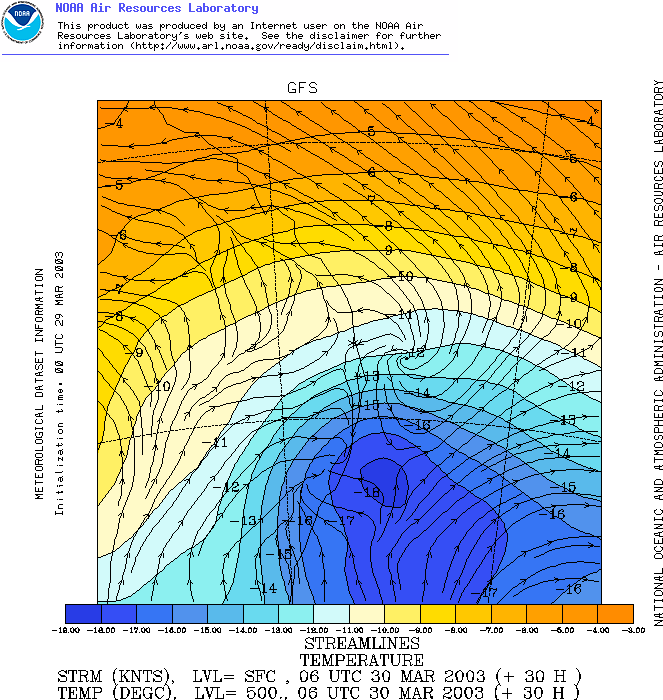
Look ok? What about the max temp? Bit high? Of course! Perhaps they meant 35? Or perhaps something else totally different! But here you just used your weather knowledge, experience and intuition to tell you that this forecast is incorrect! It doesn't look right, and it's not going to happen - that's what I mean by confirming forecasts, however we can do this at a number of levels. I've seen day 8 forecast models effectively forecast snow in north Queensland before - but you know that this is not right! Taking this into account - think about this... Why should forecast models just a day or two out be any different??? Just because it's day one or two, doesn't mean it's right! Sure it's got a better accuracy than day seven or eight, but don't believe everything you see if you don't think it's right! Those LIs of -10 or LIs of +2 - are they correct? LIs rely on quite a few things, surface temperatures, low level moisture and upper level temperatures. Just three things, right? Not quite...what influences temperature? Wind strength, wind direction, moisture, cloud cover, elevation, vegetation...and the list goes on. What influences moisture? Wind strength, wind direction, proximity to the coast, types of winds (ie seabreeze) etc. What influences the temperature influences? Well, winds rely on pressure, positions of highs and lows, seabreeze and coastal effects, then there's cloud cover - that relies on upper temperatures upper winds, upper moisture! And I could go on again about what effects all of those. Can you see what I'm getting at here? Look at how many factors we need to go through to get a stability index such as the LI. That's a lot of things that our model has to get right...what happens if our model is a little off in a couple of those? We can effectively get big changes, a small change in some of the earlier influences can have phenomenal changes on the end product. This is why I think it is important to take all models with a grain of salt - look at it. Is it right? I'm going to illustrate one method I use a lot when I don't think the LIs look quite right. I'm going to use the March 30, 2003 NE NSW/SE QLD supercell outbreak as an example. I'm also going to try and incorporate some of the techniques at the end of the first part so that you can see that they're still important. The March 30 outbreak comes with a bit of a story...stay with me and we'll see if we can get through it! On March 29, one of my best friends went chasing into S NSW (also using a very similar technique). Essentially the LIs were underprogged, and looked at soundings to trace where the cold pool would lie and look at the instability potential. To put a long story short, he rang me later that afternoon after playing in one foot golfball haildrifts! Anyway, I was watching the satpic, I was interested in the upper low, it didn't look like it was going to go E (it actually looked to be going NNE or even N still). The previous progs had showed LIs of around +2 over NE NSW. The first chart I loaded up was a 500mb chart, I was curious to see where the model was progging the positioning of the cold pool. The results were so astounding I actually saved some of the forecast progs!
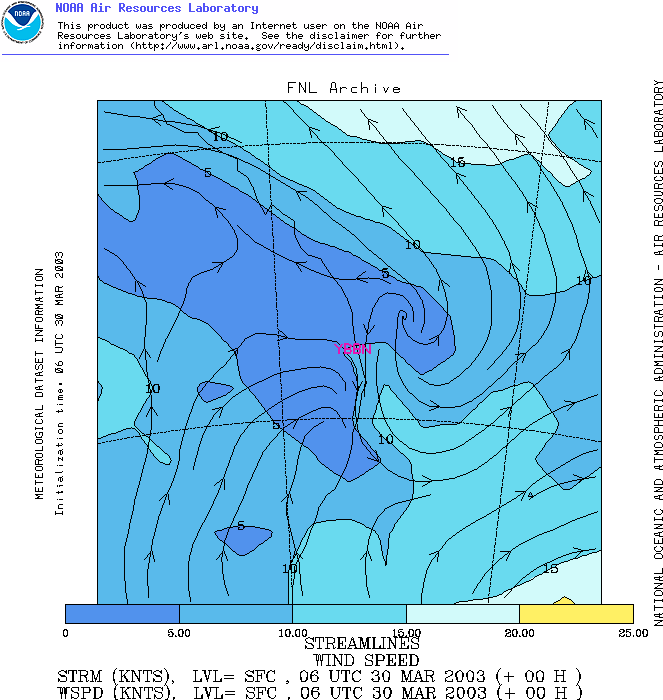
I must say, I nearly fell off my chair as I saw the cold pool just off the coast, and a large area of very cold air along the coast! My main concern looking at this was it could dry out, but I was encouraged by the SE change pushing behind it, I had a feeling it might stop the W'lies encroaching too close to the coast (like this shows it here). Well - it wouldn't quite stop it, rather the SE'ly winds would push inland and turn westerly - which isn't too bad, it provides a boundary with a pseudo-SE'ly as opposed to a real westerly. The analysis actually showed this happened in the long run:
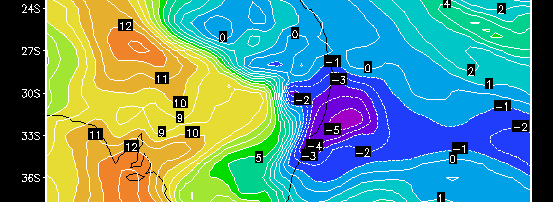
Unfortunately due to the resolution of the FNL analysis, the boundary isn't as defined here - but you can see what I mean by SE'lies tending towards the W. I was also thinking a weak high which was on the BoM charts would help keep the trough inland - it pushed it maybe an extra 50km inland, but this probably became critical as the day progressed. I then proceeded to look at the LI charts again...unfortunately I didn't save them - but Ben Quinn was kind enough to download a forecast plot for me from this day using GRADS:
Now this plot actually doesn't show bad potential
in some areas...especially the Mid North Coast (south of around 30S).
But look at the Northern Rivers area...-2 to -3 around Grafton, -1 to -2
around Casino...positive LIs in SE QLD! Things aren't really looking
quite right...I wonder what the model is forecasting? Here's a way
we can check. Perhaps the model thinks it's going to dry out?
Lets have a look. Earlier I used relative humidity to show moisture,
but there's a better way if you want the dewpoint (which is probably more
handy), and that's specific humidity. I won't go into the details
of what it is (it's actually the forecast for the mixing ratio lines),
but I'll give an approximate chart of how to convert (I worked out this
chart by looking at a Skew-T and typed it out and it's actually across
the top of my monitor, I use it religiously! I never worked out 21+
though as DPs beyond 26 are very rare):
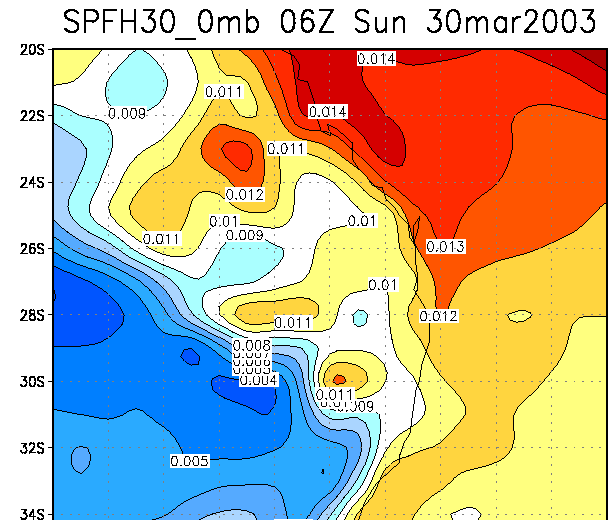
This little conversion table comes in very handy for Australia given (for some unknown reason!) no models forecast DPs straight out. Anyway, lets look at a specific humidity map. There are two types (both from AVN), one is the surface, the other is the surface 30mb (bottom 300m of the atmosphere). I always choose the surface-30mb one as it helps give a better idea on the moisture depth. Here's the forecast on that day:
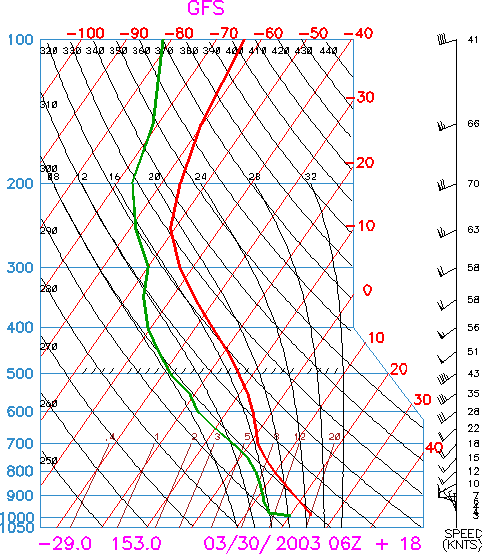
Ok, here we can see a nice tongue of moisture along the coast, specific humidity of 11-12 (Dps of 16-17) on the coast area...not too bad! Is it right? Well, I was a bit dubious because I was thinking that the moisture would actually be higher...but it might be thinking of a snip of dry air pushing into the low levels but not the surface...certainly not out of the question though! But what about the seabreeze? Unfortunately this model doesn't have the resolution to pick up seabreezes...but any seabreeze in this situation was going to have DPs in the low 20s, and they would be (well mixed) DPs of low 20s. Lets look at a forecast sounding (available from READY). This would be the best way to tell what the model is forecast now and we can start confirming our forecasts too! Especially the LI.
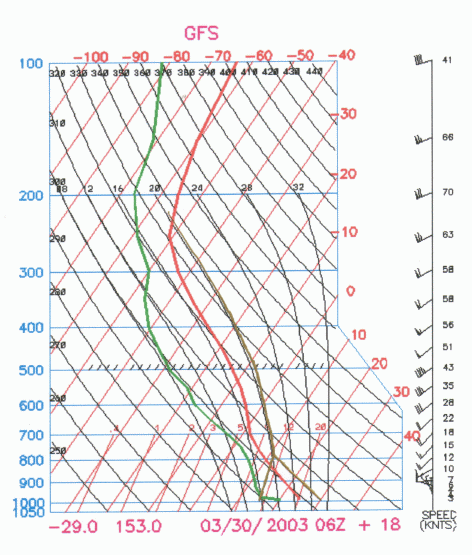
This is for Casino (well, 10km west of - close enough). Aha! There's a bit of dry air being forecast there, but it's not too bad, it's moist after that. The winds back around the NW very quickly, that's a concern...so we know that moisture is perhaps going to be a danger on this day...it's going to depend on how close the trough comes to the coast...there is a weak high out to sea, so it might help keep it just a little inland (this is something you have to decide for yourself - remember, instinct and experience!) But lets assume moisture is going to be ok...so we're going to plot it as it is with 24/15 as the maximum potential.
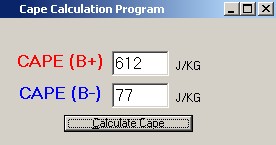
Here's our plot - hmm...the instability is pretty broad which is good! Do we agree with our forecast LIs of -2 to -3? Well plotting it like we have, we get LIs of around -3 - so they match up. I calculated CAPE too, lets look at what we got:
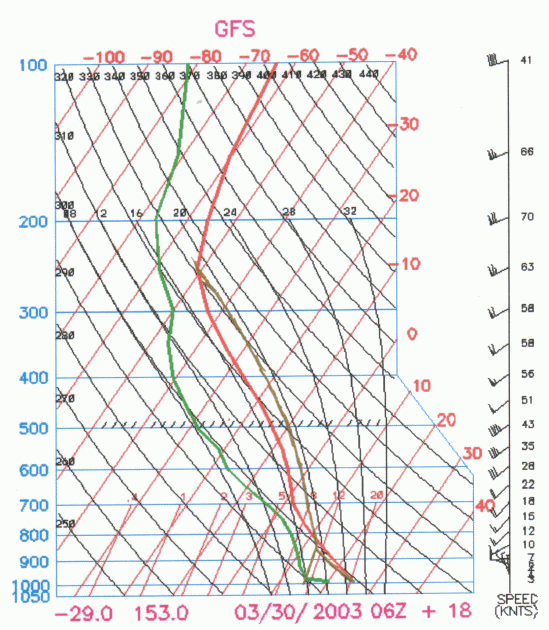
612...so there's some instability, not great...but there's some! So...here comes the fundamental question...are the LIs "correct?" Using the data (500mb temp, surface temp and low level DP) that the model has provided us - then yes. But I'd like to point out one thing (you might have already thought of it. What's the date? It's March 30...in sub tropical NE NSW/SE QLD. At 6Z we expect the temperature to be around its maximum. Is there going to be a maximum of 24C? Erm...NO!!! The maximum is going to be closer to 30 degrees! (If not higher again, this is Casino, it gets hot there!!) Ok...we're starting to think that the model might be under-forecasting the surface temperatures. So what are the effects of this? Lets replot for say 30/15.
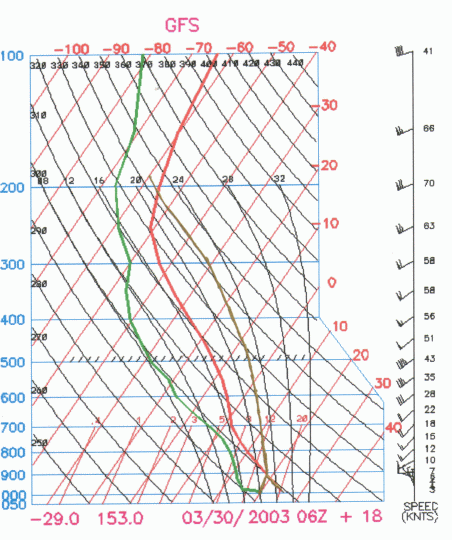
Hey now! This is getting more interesting here, -5 to -6 LIs looking at the sounding, and this is the minimum likely potential (ie 30/15). I calculated CAPE too:
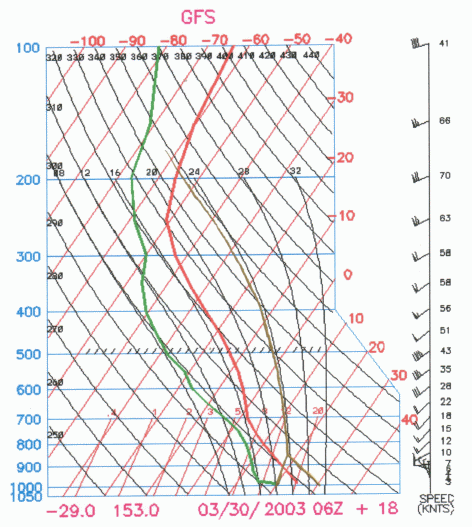
Looking better!!! One thing that I haven't mentioned (and I won't go into too much detail, more so because I don't have the data to show it properly), and that is seabreeze fronts. Seabreeze fronts can make some monsters in NE NSW and SE QLD, it's quite an interesting boundary to be on. Sometimes storms can ride along seabreeze fronts, normally a seabreeze creates an inversion and caps off development. But if a storm is already surviving, then it can draw in the warm, moist air and strengthen rapidly - especially if there is an marked increase of moisture. Lets look at the potential in a seabreeze situation...say, 24/20:
And CAPE:
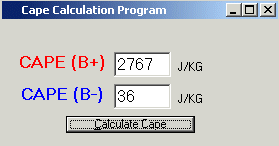
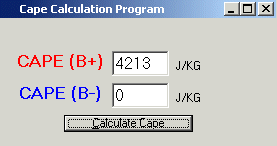
That's getting pretty unstable!!! LIs up towards -7 and -8 and CAPE of nearly 2800 - that's some nice potential storms can tap into if they get going. But notice how far we've come from our LIs of around -2? Just by looking at a forecast Skew-T and applying our own observations and forecasts, we're coming up with more accurate and realistic forecasts that truly illustrate the potential of what was an awesome day. This can work the other way too though...those -8 to -10 LIs that you might see in a forecast could actually be suffering from an over forecast of surface moisture for example - this is why confirming these types of situations and seeing if the outcome is realistic or not can be so helpful! Ok, we've looked at the minimum realistic potential...what about maximum realistic potential? One of the obs I got told was that it was 30/20 at Casino at one point...lets assume that there was plenty of moisture (the actual result was probably less than 20, but more than 15 in the 30C temperatures, so we can get an interval here).
And CAPE once again:
Not bad eh? -10 to -11 LIs and CAPE of around 4200!!! So that's our maximum potential...it won't get there, but it's nice to know. Realistically, I think the day probably saw a maximum mixed potential of 31/17 at Casino...that gives a CAPE of just under 3000! So there was a lot of instability there...the thing is, the surface temperatures were similar, but the upper level temperatures even colder down towards Grafton, so there was even further potential to the south!!! I'm hoping that this example will give you an idea on how LIs can be unreliable and misleading if you're not careful. Check them - make sure they're correct (ie understand what LIs are too, I've described it thoroughly in earlier sections). As I said before, if you understand what they actually mean, then you have a much greater chance of being successful with them and using them to your advantage. So what was the shear like? We can just read it straight off the sounding for this location! I often round up or down to the nearest 5 knots to make it easier...but 850mb 10 knots, 700mb 20 knots, 500mb 45 knots, 300mb 60 knots...and if you look at the horizontal shear maps you'd actually see the shear was stronger just south of Casino!!! And as always, the end results? See for yourself - not bad for those -2 LIs forecast eh?
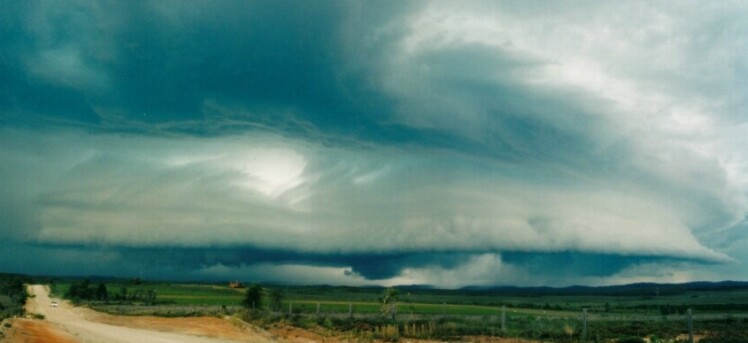
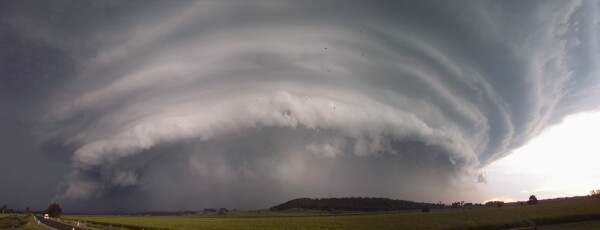
Classic supercell just NE of Grafton (80-100km S of Casino), unfortunately another supercell developed nearby and moved over the highway...my vehicle was pounded my winds in excess of 100km/h (trees falling down near the car) and hail up to golfballs as this other storm (I only saw the edge of being running into it). This was a photo by Dave Ellem who was further north of my location:
|