January 17-18 2001 SE QLD/NE
NSW
I'm going to do this a little differently...more so an analysis of this event as opposed to a forecast as such. I don't have any forecast charts either, so it makes it difficult - only analysis charts. I'm going to talk about the supercells that developed late in the afternoon of January 17, and also look at how storms were able to support tennis ball hail at 3-4am in the morning, despite it being cooler with much lower instability by then! More so the latter, because that is the focus I want to give for this section. January 17 was a big learning curve for me...it was interesting because I had never paid a significant attention to things such as capping before. It also taught me a little about the potential for drying out and the importance of shear. Anyway, lets start having a look at some sharts! First...instability...
As you can see there was no shortage of instability on this day! -3 to -6 through much of SE QLD, approaching -6 towards the border with a solid region of -6 to -9 over NSW, decreasing even further to -9 to -12 over the Grafton-Coffs Harbour region. You might be surprised to know that virtually all storms during the day were coastal! Storms developed a little further inland that night though. However a quick look at the surface winds will help reveal why that was the case:
A defined dryline was present across the eastern areas, with moisture pushing into the Sydney and upper Hunter region and into the Mid North Coast. (Being defined is important...remember, if it's illdefined or not-formed properly then the two boundaries will tend to mix and the transition will become gradual). The shallow region of moisture was back towards NE NSW and SE QLD - however this ended up most probably interacting with the seabreeze front to give some of the best storms of the day! The other thing to note was the fairly reasonable NNE flow...with relatively strong winds off the coast. While we're on the subject of winds, lets look at some other maps to get an idea of things!
The 850 winds were analysed surprisingly weak...I have an inkling that suggests these were stronger (as per the 12z Brisbane sounding), but perhaps they just increased rapidly towards the evening (which is possible). But here you can see that the winds have already backed around from the NE to the west...we've nearly done all the directional turning required here alone! 850 winds were around 10 knots in the region
Here the 700mb winds have backed around to the SW - talk about awesome directional shear! The 700 winds are quite reasonable too...20-25 knots, reaching 25-30 knots over the NE NSW region. Quite reasonable! Lets look at 500mb...
Ok...here things get a little more interesting! A good 500mb jet is rapidly pushing into the region...not only that though, look at some of the nice diffluence that has developed on the edge! A solid 30-40 knots over NE NSW too. Now this brings us to thinking about the supercell threshold of shear. Keeping in mind that with the seabreeze, NE winds were around 15-20 knots. So 30-40 knots SW'ly at 500mb provides us with 0-6km shear of between 45 and 60 knots - which fits in nicely with our supercellular threshold! For good measure we'll look at the 300mb jet too...
Once again some lovely diffluence over NE NSW and a good jet (50-60 knots in SE QLD, 70-80 knots over NE NSW). So shear is certainly supportive of supercells...so is instability...everything is perfect! And well...it pretty much is the perfect setup (which is why I've included it!) But lets look at the cap too using 850mb temperatures as a guide...
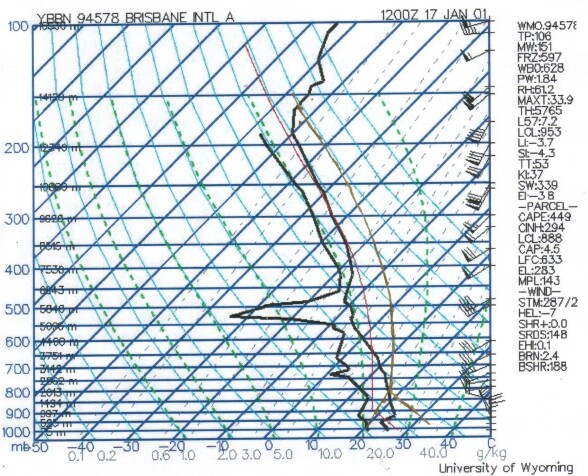
The cap was a key factor in making this day more interesting! The 850 temps were quite warm...19C right on the coast, getting to 20C along the dryline. 850 temperatures were even higher towards the NW along the dryline (hence why there were no storms to the NW, the cap was too strong!) Can you guess which way storms were going to move? The shear gave a NE'ly steering flow, but you might be interested to know that most storms moved N or NNE! This is because as mentioned before, stronger storms (especially supercells) in the southern hemisphere have a tendancy to move to the left of the mean steering flow...which is what happened on this day! In fact there was a spectacular supercell in Casino that produced some softball sized hail...check out Michael Bath's and Dave Ellem's report. I scored another supercell in SE QLD...it was an active day! But there were a few things that really enhanced it. Perhaps what was really memorable was the fantastic night development that took place...even at 3am in the morning! In fact there was tennis ball hail while CAPE was only a few hundred - how did this happen? Well, this is where the shear analysis gets interesting! And here is a classic case where horizontal shear can enhance instability! Lets look at a modified sounding...I've used the Brisbane sounding here (12z for this day), and plotted the maximum potential for Casino (34/20) on it...
You can see how unstable it was - especially in the mid levels with that upper trough pushing through! LIs were well towards -10 as we saw in the forecast. A quick check of CAPE in the afternoon reveals some impressive instability too!
Plenty of instability to support powerful updrafts with large hail...no wonder there was some massive hail! But what about in the evening? At 10pm there was a severe squall line that moved through NE NSW and SE QLD...ok...there would have been some residual instability leftover and that squall line actually developed west of the dryline (amazingly!) and moved across and sustained itself...once storms develop, it's easier to maintain them...the hard work is often forming them in the initial stage. But then at 1-2am, storms developed in the Downs and moved over north Brisbane bringing tennis ball hail! But it didn't finish there...at 4:30am more storms began to develop on the border ranges and they moved over Brisbane becoming severe yet again! Yet if we look at the above sounding (the red line is the unmodified night sounding), we see unstable mid levels - but not much else! CAPE is only 449, how does that work to produce tennis ball hail!!! Well, the key can be having a look at a few more charts - namely shear. Lets look at a surface chart for 4am...
This is a big change from 12 hours ago! Our dryline has actually disappeared...but the trough remains. Note along the trough (spiralling inwards, indicating a low), that we have confluence. But also note that there are effectively NE'lies feeding into both sides of this through! First there are the northerlies on the northern side, but also note that the SE'lies are really pseudo NE'lies because that is their point of origin. Further west along the trough there are true southerlies as that is their origin. So this is interesting...a lot of moisture has been pumped into this trough in a small amount of time...one thing that potentially happened is this moisture mixed with the heat on the Downs leftover from the day before and this helped produce additional instability. But it still doesn't quite explain the Brisbane stuff - which was cooled by storms already! Lets delve a bit deeper...
I've skipped 850...but it was W'ly at 15 knots if you're interesting...so we still have strong directional turning. Here the 700mb chart gets a little interesting...25-30 knot SW'ly...fantastic directional shear is persisting! Notice a little diffluence west of Brisbane? Interesting...lets go up another level to 500mb...
A very nice mid level jet here! Pushing 40-45 knots and getting up to 50 knots over the Downs. But also notice something else - notice how the area is nicely diffluent? Also note that here, we're on the right exit region of the jet...due to the structure of jetsteams, air tends to rise on the right exit region (in the southern hemisphere, in the northern hemisphere it's the left exit region). So how much air is rising? Well, before we look...lets look at a 500mb temperature chart...both at 6z and 18z...
Wow - that's a nice little upper level trough pushing into SE QLD and NE NSW there! That's contributing to the destabilisation of the mid levels quite nicely - swift moving upper trough are good at doing that...but not only that, they also help to lift the air in general around them. So if we have two things (diffluent 500mb jet) and the upper trough moving in the region then we would expect to see this in the vertical wind charts. Do we? Lets look!
Hmm...solid -15 to -20 VV's (vertical velocities) over the Brisbane region...certainly quite nice and quite supportive! Lets check 300mb...
There is some awesome diffluence happening here! And Brisbane is right under the right exit region too. Just without looking at the upper temperatures, you can see there must be a sharp 300 trough pushing into the Mid North Coast (31-32S) area because of where the winds suddenly slacken (due to the weaker temperature gradient). Once again...a look at VVs...
Even better here! Solid -20 to -25 and even -25 to -30 VVs over the Brisbane region. So just by a few proccesses: - Horizontal shear arranging itself in such
a way it induces favourable vertical shear
We can see that while the atmosphere is not hugely unstable...when you combine it with the awesome horizontal shear (supportive of supercells) you can get severe storms. Also, the vertical shear has helped enhance the current instability there is there now (so perhaps it might have the equivalence of a CAPE of 1000 instead of 450 due to the vertical shear. It's not quite that figure...I've never calculated it, but I'm just giving you an example!) This concludes this part, but ties into the last part which discusses storms and severe thunderstorms when you probably wouldn't pick it! |